
Microsoft recently re-added the ability to add stock quote information to Excel spreadsheets. The date is delayed by 15 minutes, but you can click the update button to automatically have data for hundreds of stocks update.
They offer many fields in their data including:
- ticker symbol
- price
- open
- previous close
- change %
- change $
- day’s high
- day’s low
- 52 week high
- 52 week low
- ticker symbol
- beta (for most stocks, though on some this is blank)
- today’s volume
- average daily volume
- stock float
- market cap
- industry
- exchange
- year founded
- company description
- CEO
- employee count
- headquarters
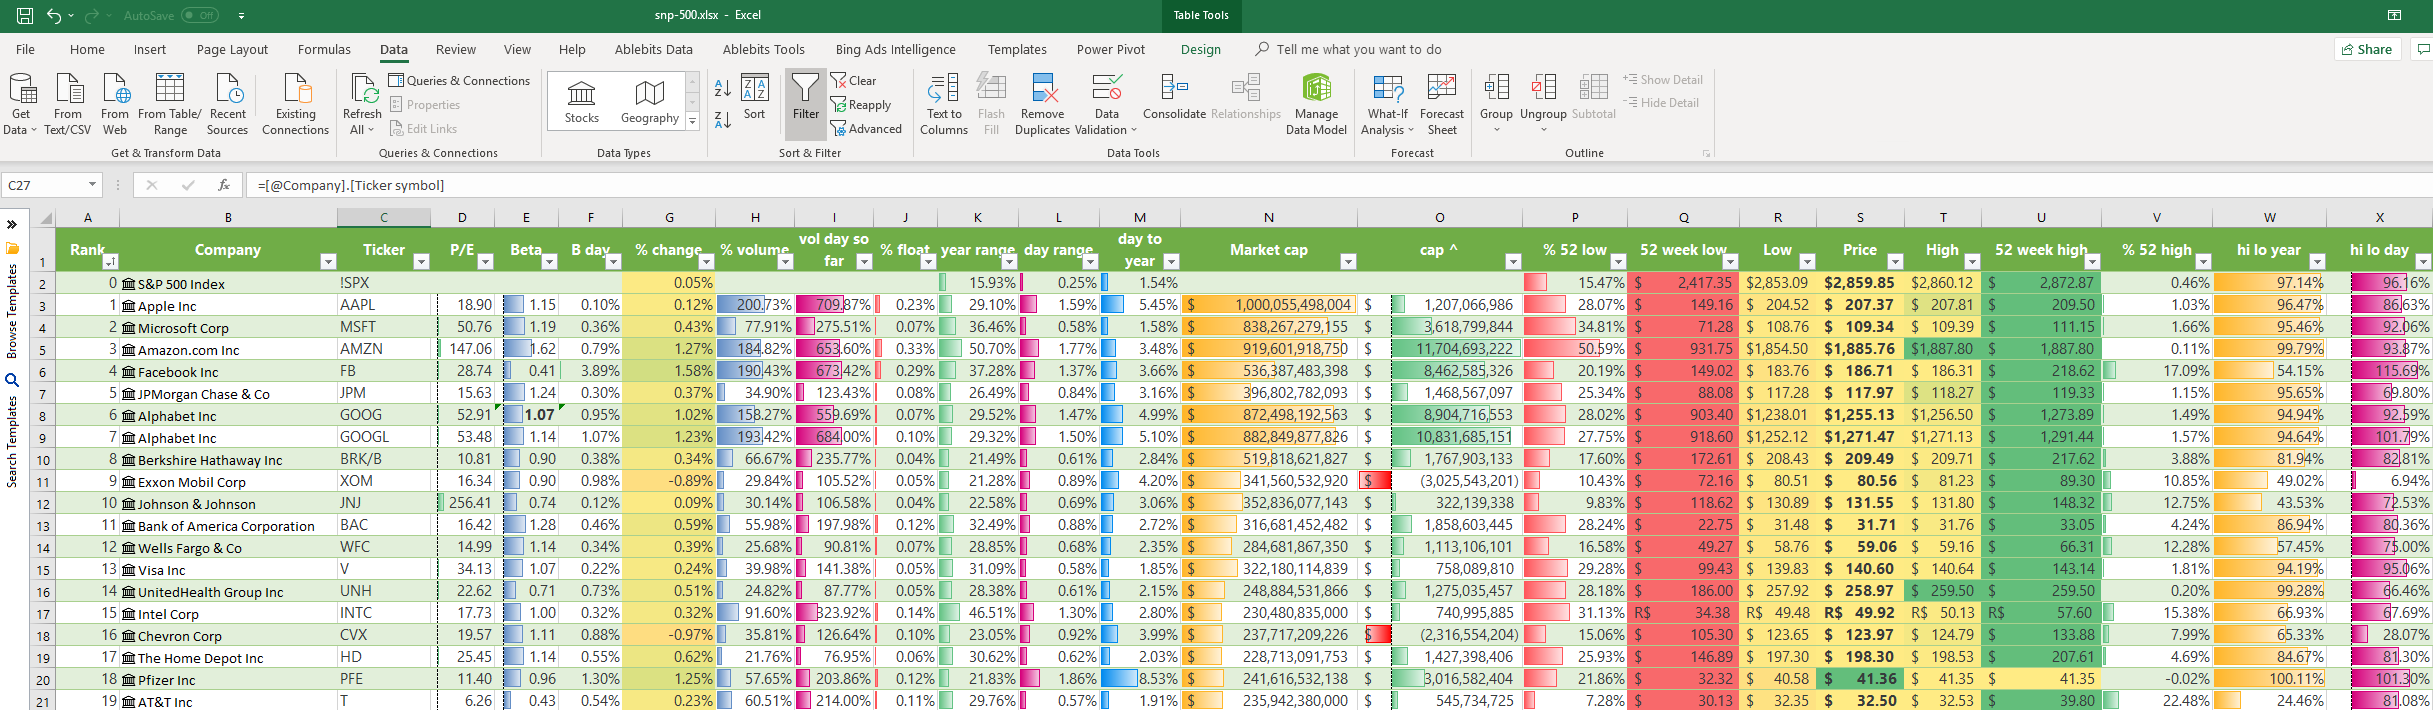
You can see the sort of spreadsheet you can create mostly automatically (though with a few manual tweaks) from the following image.
On the initial roll out of the feature they made it available for people who have active Office 365 subscriptions & who enabled the Office Insiders feature.
- If you have an older version of Office or bought a key card the first step is to buy an Office 365 subscription.
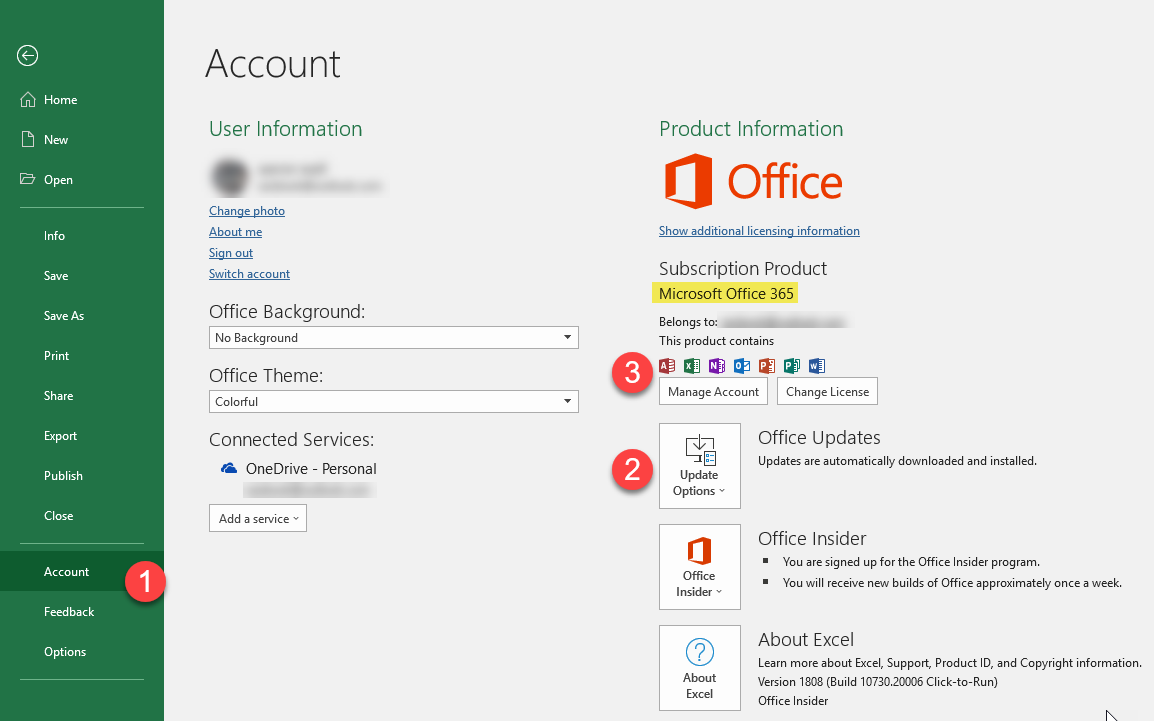
- The next step is to update to the latest version of Office, which may require restarting the computer. You can see if there are updates available by clicking on the “Account” link in the left rail menu of Excel. Then click on “Office Updates” to see if there are any updates available by clicking on the “Update Now” submenu that appears after clicking on the “Office Updates” button.
- After that, open up Excel and once again click on the “Account” link in the left menu. Now in the right rail of the page you can click on the “Manage Account” button. That should either open up a pop up which lets you select Office 365 connection, or send you to a page on Microsoft’s site to enable Office 365. Here is a screenshot to show the areas referred to in this text. When you are done you should see Microsoft Office 365 listed in the right column.
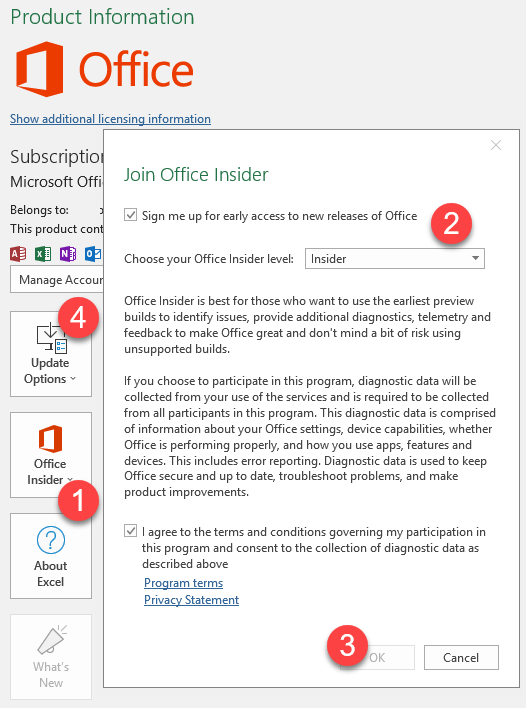
Now the only step left is to enable Office Insider. Here are instructions directly from Microsoft on how to do that.
- In any Office 2016 app, click File > Account > Office Insider. Select the Get early access to new releases of Office box, specify an update level, and then click OK.
- Visit the Additional Install Options page of My Account. Sign in with your Microsoft Account, if needed. In the Version menu, click the type of Insider build you want to install, and then click Install. If you already have Office 2016 installed on your Windows desktop, you do not need to uninstall it first. You’ll be updated to the Office Insider build. If you don’t see an Insider option on the Version menu, you may not have an active Office 365 subscription.
Once you have done the above, make sure your Office Insider level is selected to Insider
After you save that, you can once again click on Update Options and click on Update Now from that menu.
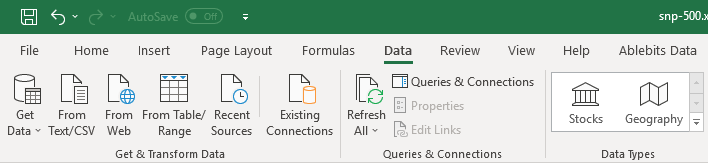
You may have to close out of all Office documents & restart your computer again to get it to work, but you will know it works when you see the stock data type in the header area.
From there, you follow the instructions given here to add stock data to a spreadsheet.
- Type ticker symbols or company names into cells.
- Create a table ( Insert > Table)
- Select the cells with ticker symbols or company names in them
- Click on the top data tab in Excel & click on Stock data type. This should automatically link the stocks to the company name. Then you can click on the top right row in the table to add fields like current price, change, etc.
- To update stock pricing data click on the “Refresh All”
If you have multiple computers and are struggling to update the second computer to the insiders setting you may have to visit this page.
For your convenience, here are a few sample stock spreadsheets, though they will only work if you have an Office 365 account, are an Office Insider & completed the above steps.
- S&P 500
- Nasdaq 100
- Dow Jones Industrial Average – one sheet for the DJIA and a second sheet for the transports.
- Dividend Aristocrats – companies which have regularly increased their dividends.
These spreadsheets use sortable columns which make it easy to quickly see
- what has went up or down the highest percent
- what had the biggest move today relative to its beta
- what has gained or lost the most market cap today
- how far a stock would need to fall to touch its 52-week lows
- how much a stock would need to go up to touch its 52-week highs
- the range of the stock today
- the range of the stock this year
- the range of the stock today vs the range of the stock this year
- where stocks are in their 52-week channel & in its range for the day
A couple notes on the above spreadsheets.
- Where the automated data connections worked we used whatever data Microsoft includes.
- If automated data connections did not work for a particular data point, then we might have manually entered in the beta level for the stock price at that point in time.
- Most the data is quite reliable, but in some cases the 52-week high or low data point seems to be stuck on a couple stocks like Ctrip. As Microsoft improves the offering & rolls it out more widely these issues will likely be fixed.
- The weighting aspects on the indexes were based on data from SlickCharts from about a week ago.
The official Microsoft stock data integration is easy to update on an automated fashion quickly. If you prefer to have real-time stock data & have the data update without having to click on a refresh button then Michael Saunders offers a nice third-party plug-in. His plug-in is free & it offers real-time data for a one-time Paypal donation of only $10. He offers a downloadable spreadsheet for automated portfolio monitoring. His plug-in is great for watching a couple stocks or a small portfolio, but is less idea for looking at a broad index like the S&P 500 as you have to manually connect each stock one at a time.